The Leading Source for Wine Industry Data

Wine Analytics Report
A monthly digital publication.
The latest wine industry metrics, market analysis and trends shaping the wine industry.
Ensure your company's success by making informed business decisions based on market conditions and emerging trends.
Industry Databases
Exclusive access to proprietary industry data.
Identify potential sales prospects and new markets.
Create and save searches for highly tailored results.
Buyer’s Guide
Easily locate products and services.
Identify vendors and products across 190 winery categories and 365 subcategories.
Refine search with subcategories and product detail.
Includes over 2000 wine industry vendor profiles outlining their product lineup with contact links.
Directory
Current and comprehensive guide of wine and grape industry professionals in North America.
Identify prospective clients.
Available in print.
The Analytics Report and monthly insights are core to how we evaluate performance and identify key market segments. The data is timely, relevant, and helps us stay informed and strategic year-round.
Far Niente Winery
The Winery Database from WBA has significantly sharpened our understanding of the wine industry landscape and made it much easier to identify, prioritize, and focus on the clients and segments that matter most.
Radoux USA
The information provided through WBA has been a valuable tool in helping me better understand client needs and market trends—allowing me to serve our customers more strategically and effectively.
Guala Closures


WINE INDUSTRY METRICS
| Total U.S. Wine Sales | |||||
| Month | 12 Months | ||||
| May 2026 | $8,317 mil | 2% |
$114,882 mil | 3% |
|
| May 2025 | $8,132 mil | $111,961 mil | |||
| Month | 12 Months | ||||
| May 2026 | $955 mil | -5% |
$13,421 mil | -6% |
|
| May 2025 | $1,008 mil | $14,246 mil | |||
| Direct-to-Consumer Shipments | |||||
| Month | 12 Months | ||||
| May 2026 | $246 mil | -10% |
$3,647 mil | -5% |
|
| May 2025 | $273 mil | $3,832 mil | |||
| Winery Job Index (100 = Jan. 2007) | |||||
| Month | 12 Mo Avg | ||||
| May 2026 | 327 | -17% |
270 | -23% |
|
| May 2025 | 395 | 350 | |||
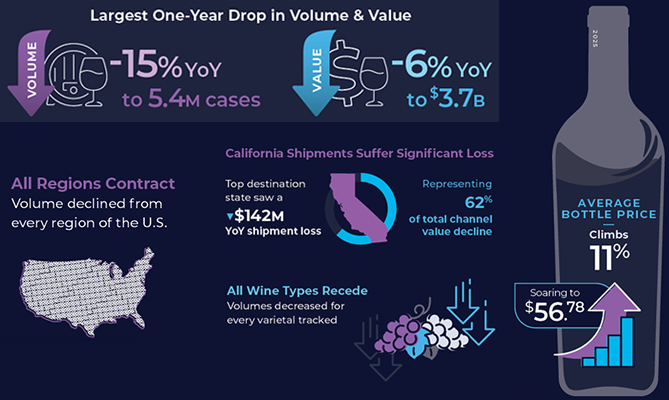
Even though Napa County winery shipments grew 7% to $784 million through May, it was not enough to offset the $112 million in losses among other regions. Total shipment value year to date came to slightly less than $1.5 billion, trailing the same period last year by 4%.