The Leading Source for Wine Industry Data

Wine Analytics Report
A monthly digital publication.
The latest wine industry metrics, market analysis and trends shaping the wine industry.
Ensure your company's success by making informed business decisions based on market conditions and emerging trends.
Industry Databases
Exclusive access to proprietary industry data.
Identify potential sales prospects and new markets.
Create and save searches for highly tailored results.
Buyer’s Guide
Easily locate products and services.
Identify vendors and products across 190 winery categories and 365 subcategories.
Refine search with subcategories and product detail.
Includes over 2000 wine industry vendor profiles outlining their product lineup with contact links.
Directory
Current and comprehensive guide of wine and grape industry professionals in North America.
Identify prospective clients.
Available in print.


WINE INDUSTRY METRICS
| Total U.S. Wine Sales | |||||
| Month | 12 Months | ||||
| June 2025 | $9,543 mil | 3% |
$111,885 mil | 4% |
|
| June 2024 | $9,243 mil | $107,833 mil | |||
| Month | 12 Months | ||||
| June 2025 | $969 mil | -5% |
$13,756 mil | -5% |
|
| June 2024 | $1,025 mil | $14,517 mil | |||
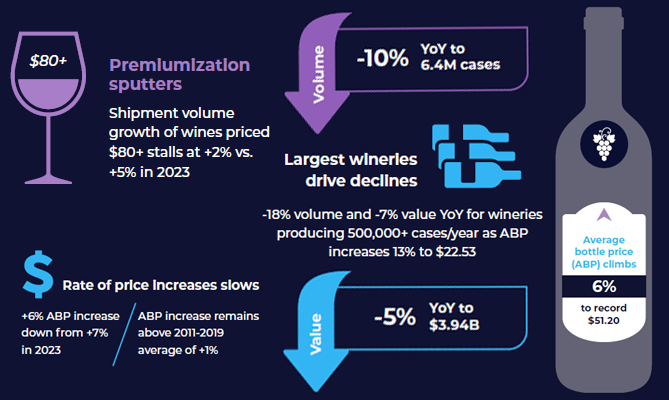
| Direct-to-Consumer Shipments | |||||
| Month | 12 Months | ||||
| June 2025 | $149 mil | -0% |
$3,831 mil | -5% |
|
| June 2024 | $150 mil | $4,036 mil | |||
| Winery Job Index (100 = Jan. 2007) | |||||
| Month | 12 Mo Avg | ||||
| June 2025 | 334 | -27% |
340 | -24% |
|
| June 2024 | 455 | 450 | |||
Napa and Sonoma county wineries accounted for 67% of total winery DtC shipment value in the 12 months ended June. Shipments by both counties declined by both value and volume compared to same period last year.